COVID-19 outbreak did not affect significantly the status and routine of PSC in the USCG area of responsibility. The reduction to inspections was 15% while the Global PSC showed a decrease number of 30%.
During 2019, 8,622 PSC Inspections conducted in USCG while during 2020 the number was 7,383. The five-year average on PSC inspections (2016-202) is 8,799 inspections. The key figures and PSC KPIs for 2020 are shown on Table 1.
|
Inspections |
7383 |
|||
|
Detentions |
57 |
Detention rate (DER) |
0.77% |
|
|
Deficiencies |
2877 |
Deficiency Per Inspection (DPI) |
0.38 |
|
|
Inspections with at least one deficiency |
1363 |
Inspections with def. Rate (DIR) |
18.46% |
|
|
Inspections with more than 5 def. |
40 |
Insp.with more than 5 def.Rate (FDR) |
0.54% |
|
|
Clean Inspections |
6020 |
Clean Inspection Rate (CIR) |
81.54% |
Table 1: Key figures and PSC KPIs for 2020 in USCG
The Global average during 2020 for DER is 2.13% and for DPI is 1.52; considering these, the figures for USCG are significantly lower. The reason is that ships visiting USA are well prepared for a detailed inspection. So findings are significantly reduced in comparison with previous years.
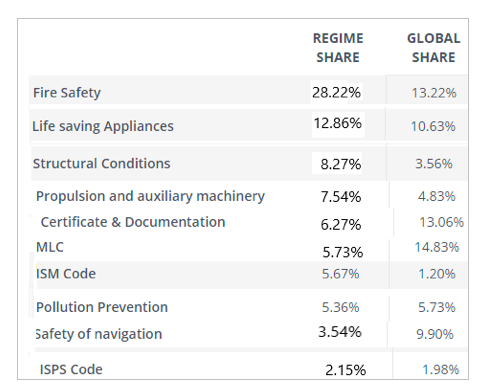
Table 2 shows the most common deficiency areas marked during 2020. The rest of deficiency categories had significant lower share during 2020.

Table 2 Most common deficiency areas in USCG during 2020
In respect of detentions the distribution of detentions per ship type was:
- Bulk Carriers: 21
- General Cargo: 19
- Tankers: 2
- LNG/LPG: 2
- Container: 9
- Other: 4

Table 3: The top 10 detainable deficiencies in USCG, during 2020
The most common detainable deficiencies are divided in two main areas:
- ISM Code: The implementation of the code as a result of generic safety conformance of ship and managed company is considered very important in USCG area due to maintenance reasons (the most common detainable deficiency); the policies (safety and environmental) and; handling of non-conformities or deficiencies.
- Pollution prevention issues. Oil accumulation in engine room and oil record book are the most common detainable deficiencies.
Overall, ship Managers and operators should be duly prepared for USCG officers’ PSC inspections not only by ensuring enhanced ships condition and safety performance, but also by having effective SMS in order to respond to detailed ISM code inspections in United States of America.